
Can You Balance Your Freight Network in Florida?
- John Doe
- Us freight lane strategies
- June 18, 2025
Table of Contents
Florida’s Imbalanced Freight Market: A Narrative That’s Completely True
Florida’s dry van freight market is notoriously imbalanced: inbound loads far outnumber outbound ones. Florida’s load inbound/outbound balance runs about 1.5 to 1.
The reason for the imbalance is simple. Florida has a massive consumer base that generates inbound loads. In 2024, US Census estimated Florids’s population at 23.4 million. On top of that, 1.4 million visitors are in-state on any given day. That brings Florida’s effective daily consumer base to about 24.8 million people
Florida definitely lacks the production base to fill the amount of trailers that move loads to cover the consumption of 24.8 million. Nevertheless, your freight network represents a portion of Florida’s total freight network. Is it possible to develop a shipper search strategy that might balance your freight network? We use a back-of-the-napkin approach with three core data sources:
- West End Alt’s geospatial analysis of Florida’s distribution network
- The US Census’ Commodity Flow Survey
- The US Census’ County Business Pattern Survey
In Florida, Distribution Centers and Warehouses Align with Population Patterns
We monitor trailer flows at three of Florida’s key freight gateways:
- I-75 and I-95 (north): Main corridors to/from Georgia and the Eastern Seaboard
- I-10 (west): Florida’s link to the other Southerneastern US
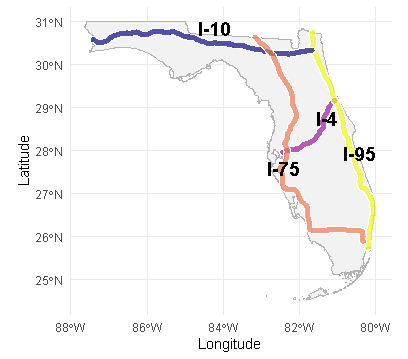
Figure 1 : In this post, we focus on Florida’s freight flows with other US states. We include I-4 also because I-75 and I-95 feed freight into I-4.
| Load Type | I-10 | I-75 | I-95 |
|---|---|---|---|
| Inbound | 965 | 4,172 | 3,299 |
| Outbound | 789 | 2,782 | 2,200 |
67% of Florida’s population lives within a 10-mile buffer of its interstate freight corridors. This density helps explain why trailer volume on I-75 and I-95 is 2–3× higher than on I-10.
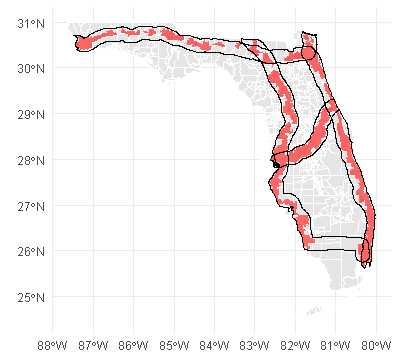
Figure 2: This map shows the 10 mile buffers around Florida’s interstates against US Census tracts. Using tracts allow us to get a more granular population count for the geography that intersects with the 10 mile buffer. The tracts completey covered by the buffer represent 67% of Florida’s population. If we included tracts that intersect in any way with the buffer, 67% would rise to 79%.
Operators of distribution centers and warehouses got the memo regarding how concentrated Floridians are around interstates.
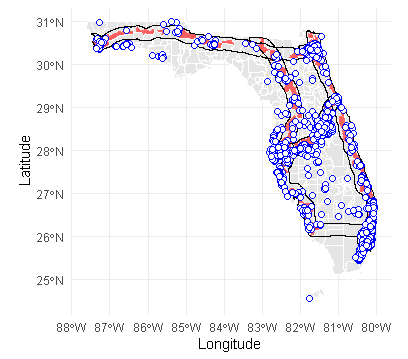
Figure 3: Distribution centers and warehouses in Florida closely mirror the population distribution, reinforcing why backhaul freight can be planned strategically along high-density lanes.
Key Takeaways
- I-10 handles far fewer loads than I-75 or I-95 — meaning limited westbound outbound capacity.
- Florida’s consumer base is highly centralized — especially around the I-4 and I-95 corridors.
- Distribution centers align with population, offering opportunities to optimize backhauls if planning is data-driven.